
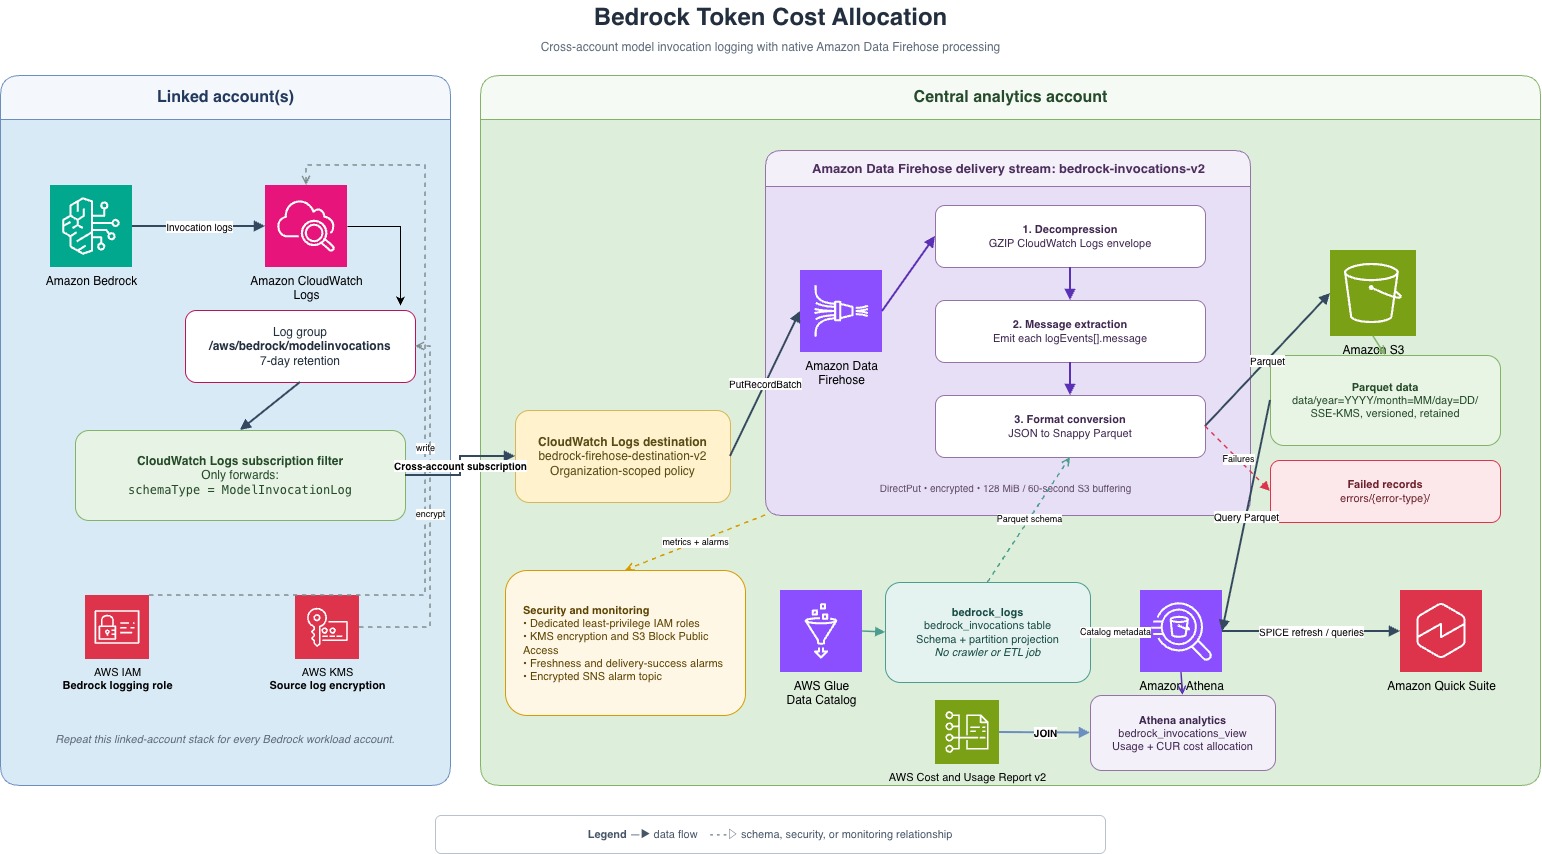
If you need an observability data lake for your Amazon Bedrock workloads, you’re not alone. When you’re running thousands of model invocations a day across multiple accounts, after a request is sent you might be wondering, what happened? You can see the aggregate bill, but you can’t see what happened inside each call. You might start to ask questions: what prompt was sent, what the model returned, how many tokens it used, which model handled it, and whether the response was any good! If you’re a platform or machine learning (ML) engineer looking after a fleet of Amazon Bedrock workloads across teams, that’s a real problem. You can’t debug a spike, you can’t spot wasteful prompts, and you can’t tell one team’s usage from another’s. We built something to help: a centralized observability data lake for your Amazon Bedrock invocations. In this post, I cover what native data you have and how we designed the lake. I also show how to use it to see your prompts and derive the per-invocation cost. The AWS CloudFormation templates, AWS Lambda code, and SQL queries are all in the AWS Sample Bedrock Invocation Data Lake GitHub repository . This post walks through the architecture and deployment steps. The repo has everything you need to deploy it. What Amazon Bedrock visibility do you have today? Amazon Bedrock offers model invocation logging , and it’s genuinely powerful. You turn on invocation logs in the settings in each AWS account you are using Bedrock . It delivers a full record of requests and responses to Amazon Simple Storage Service (Amazon S3) or Amazon CloudWatch . The data
Source: AWS Artificial Intelligence